Survey 2012
The survey was based on a voluntary participation open to all engineering institutes which had completed 10 years as on 31 August 2012 and offered at least three out of shortlisted six streams of engineering. The study saw participation by 156 AICTE approved engineering institutes across eight AICTE zones in India. Following is the region-wise distribution of institutes which participated in the survey; along with the total number of eligible institutes in each state/zone.
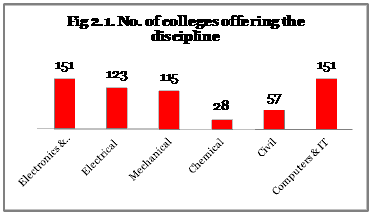
The institutes under the study offer various disciplines including Electronics & Communication Engineering, Electrical Engineering, Mechanical Engineering, Chemical Engineering, Civil Engineering, and Computers & IT Engineering. Fig 2.1 shows the coverage of various disciplines across the institutes covered under the study.
Methodology of Evaluation
The selection criterion and the methodology adopted for evaluation is mentioned below. The survey was conducted online through login by institutes into AICTE portal using their AICTE ID.
Eligibility for participation: The institute should be:
Operational for at least 10 years as on 31 August 2012
Offering at least 3 streams out of following 6 streams – Chemical, Civil, Computer & IT, Electrical, Electronics & Communication and Mechanical Engineering
The selected institutes were evaluated across 7 dimensions and each of these 7 dimensions was allotted individual weightages as shown in the table below:
S. No |
Dimensions |
Weightage |
| 1. | Governance |
10% |
| 2. | Curriculum |
15% |
| 3. | Faculty |
15% |
| 4. | Infrastructure |
10% |
| 5. | Services |
20% |
| 6. | Placements |
20% |
| 7. | Entrepreneurship Development |
10% |
Total |
100% |
Structured questions and evaluation parameters were designed across each of the dimensions mentioned above and respondents were asked to provide answers to the questions during the survey. The table below shows the evaluation parameters against each dimension.
No. |
Dimensions |
Evaluation parameters |
| 1. | Governance |
· Number of Industry members on Board of Governors · Percentage of Industry members attending Board of Governors meetings last year · nbsp;Number of Industry members on Institute’s committees · Percentage of Industry members attending committee meetings last year |
| 2. | Curriculum |
· Number of courses that received amendments after inputs from industry · Average duration of Industrial training/ internship · Number of Industry visits for students · Number of students visiting industry · Number of Industry guest lecturers/ seminars conducted |
| 3. | Faculty |
· Number of executive programmed provided by faculty to industry executives · Number of Industry executives attending such courses · Number of faculty members on the boards of industry · Number of faculty members provided in-company training/ lecture are to industry · Number of programmes attended/ trainings received by faculty from industry · Number of faculty members who have sent/ presented papers to industry · Number of faculty patents adopted by industry into products |
| 4. | Infrastructure |
· Number of centers/ units/ cells financially supported by industry · Percentage of financial contribution by industry in the unit |
| 5. | Services |
· Number of research projects assigned to institute during 2007-12 · Number of technology transfers to industry during 2007-12 · Number of consultancy/ advisory services provided to industry during 2007-12 · Number of infrastructures used by industry during 2007-12 · Number of testing services provided to industry during 2007-12 |
| 6. | Placements |
· Number of students offered jobs from campus in 2011-12 · Number of students offered jobs from campus during 2007-12 · Number of students offered jobs in respective core companies in 2011-12 |
| 7. | Social Development |
· Number of companies providing mentoring/ teaching/ funding to incubates during 2007-12 · Number of innovation initiatives supported by industry during 2007-12 |
The survey was open for three months i.e. from 7th June to 7th September, 2012. Over 300 applications were created on the portal and final submission was made by 156 institutes. An Objective Evaluation was conducted based on computer generated results and a five-member jury did the first round of evaluation and shortlisting.
Assessment at the national level
The average composite score at national level is 30.9. Minimum and maximum scores obtained by the institutes under study are 4.4 and 75.7, respectively. Scores obtained by the institutes under the study are presented in Annexure 4.2.
Fig 3.1 Normal Distribution of scores across 156 institutes
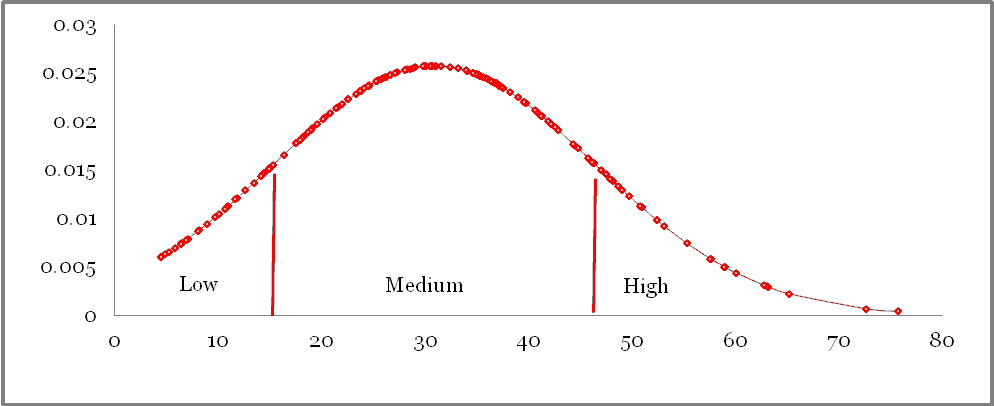
The institutes have been classified on three levels (High, Medium, and Low) of the scores based on the performance assessment scores obtained by the institutes mapped to a normal distribution curve.
The findings are shown in the table below:
Level |
Index Score |
Number of Institute |
Percentage Contribution |
High |
Above 46 |
28 |
19% |
Moderate |
15 – 46 |
99 |
63% |
Low |
>15 |
29 |
18% |
Total |
156 |
100% |
Based on the understanding from the survey conducted, the key characteristics of institutes falling in high and low categories respectively are highlighted in the table below:
Levels of Sustainability |
Characteristics |
High |
Institutes which rank high generally display most of the following characteristics across the seven parameters under study: Governance
|
In a normal distribution graph 68% of scores obtained are within one standard deviation (σ) from the mean; 96% of the scores lie within two standard deviation; and about 99.7% are within three standard deviation. The mean and the standard deviation in this case is 64.9 and 9.24. We have segmented the sustainability index using intervals of standard deviation into high, moderate and low categories representing 16%, 68% and 16% of the survey population.
Reports Feed
- AICTE-CII Survey Report 2019
- ASHE 2019
- EdCil CII Survey on Internationalisation of Indian Campuses 2019
- CII PWC Note on Internationalisation 2019
- AICTE-CII Survey Report 2018
- AICTE-CII Survey 2017
- School Education Report 2017
- AICTE-CII Survey Report 2016
- AICTE-CII Survey Report 2015
- ASHE 2015
- Trends in Internationalisation of Higher Education in India 2015
- CII - Nature Index 2015
- Glimpses of MoU Exchange Ceremony at Rashtrapati Bhavan 2015
- CII-i3 Innovation Challenge 2015
- CII-i3 Award Winners 2015
- India Citation Index 2015
- AICTE-CII Survey Report 2014
- ASHE 2014
- Trends in Internationalisation of Higher Education in India 2014
- CII Directory of Top Industry-Linked Tech Institutes 2014
- AICTE - CII Survey Report 2013
- ASHE 2013
- White paper on Administrative Reforms 2013
- Case Studies on Industry Academia Collaboration 2013
- AICTE - CII Survey Report 2012
- ASHE 2012